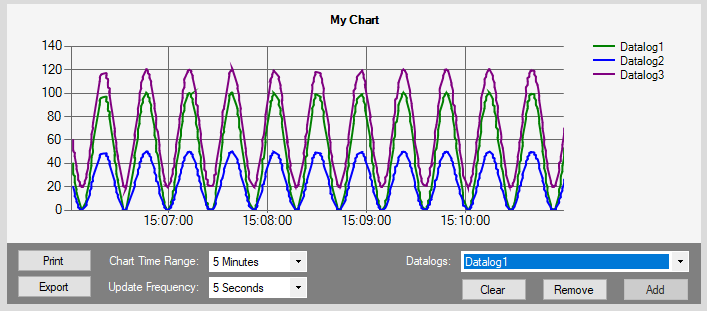
The Datalog Chart control is used to plot data from selected Datalogs by pulling values from the database.
The time range of data to plot can be modified during operation but care should be taken for large data sets as plotting thousands of data points can take a very long time.
The auto update feature allows automatic refresh of data and care should be taken to not set this frequency lower than the time it takes to draw the data (for example update frequency is 1 second and time range is 24 hours).
Open the destination window to add the Control.
From the Toolbox, select the Control icon, move the pointer into the window and drag out the initial position and size for the control.
If the Property Editor is not displayed, click on Ribbon > Home > Property Editor
Click on the Control. The Properties for the control will appear in the Property Editor panel and allow changes to be made.
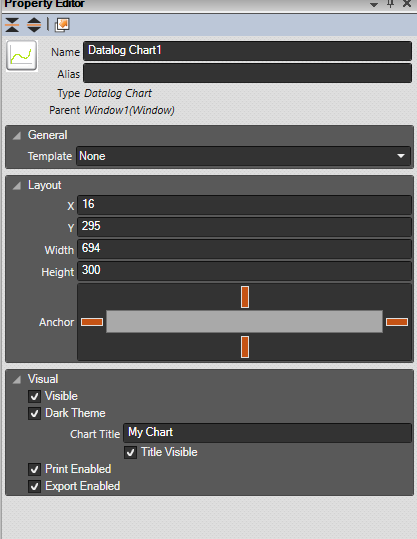
Name: Name of the control
Alias: Alias of the control
General:
Template: Select a template from the defined templates to use for this control. See Templates.
Layout: Determines the layout parameters for the control
X: X location in the window to place the control
Y: Y location in the window to place the control
Width: Width of the control
Height: Height of the control
Anchor: Which edge of the window the control is anchored to when the window is resized. See Anchors.
Visual: The Visual category allows the user to configure the look and feel of the control.
Visible: Defaults to visible but untick if you wish this Control to be invisible
Dark Theme: This option allows a dark theme or light theme.
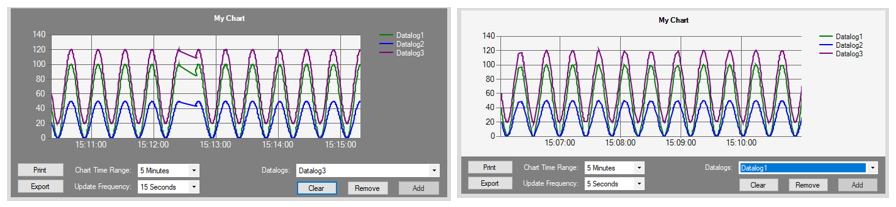
Chart Title: The title to display on top of the chart.
Title Visible: This allows the title to be hidden.
Print Enabled: Enables the 'Print' button that allows printing the current chart.
Export Enabled: Enables the 'Export' button that allows the export of current datat to a CSV file.
Usage:
Datalogs: A list of current Datalogs will be available in the drop down list. By selecting a specific item, it can either be 'Added' or 'Removed' from the current plot. The 'Clear' button removes all plots.
Chart Time Range:This option specifies the time range to collect data for.
NOTE: This option could result in thousands of data points to be plotted which can take some time.
Update Frequency:To automatically fetch new data from the server, use this option to specify how often the updates must occur.
Setting this to 'NONE' stops updates.
Print:This allows the current chart to be printed to an installed printer. Updates are paused during this operation.
Export:This allows the current data to be exported to a CSV file. The file format is in the following format:
Datalog 1 Name,X0,X1,X2,…,Xn
Datalog 1 Name,Y0,Y1,Y2,…,Yn
Datalog 2 Name,X0,X1,X2,…,Xn
Datalog 2 Name,Y0,Y1,Y2,…,Yn